How Support and Resistance Impact Commodity Prices
How Support and Resistance Impact Commodity Prices
Support and resistance levels are key tools in commodity trading. Here's why they matter:
- Support: A price level where a commodity typically stops falling and reverses upward. Example: Oil consistently rebounding at $70 per barrel.
- Resistance: A price ceiling where prices struggle to rise. Example: Gold failing to surpass $2,100 per ounce.
- These levels help traders decide when to buy, sell, or set stop-loss orders. They can also flip roles - support can become resistance and vice versa.
Understanding these levels involves analyzing historical price data, using tools like moving averages and trend lines, and considering psychological factors like round numbers. Real-time data is essential for tracking these changes effectively.
For traders, mastering support and resistance offers a practical way to navigate volatile markets like oil, gold, and natural gas.
How To Draw Accurate Support And Resistance Levels (Must Watch)
How to Find Support and Resistance Levels
Identifying support and resistance levels is a key part of commodity trading. These levels give traders clear entry and exit points, which is especially useful in volatile markets like oil, gold, and natural gas. To locate them, you’ll need a mix of historical price data and technical analysis tools.
Using Past Price Data
Historical price movements are an excellent starting point for spotting support and resistance zones. By studying past charts, you can pinpoint areas where prices repeatedly paused or reversed. These recurring patterns often highlight significant levels that can continue to influence future price behavior.
Repetition strengthens these levels. If a price repeatedly approaches a level but fails to break through, that level becomes more reliable. For example, a resistance level that holds firm over several months carries more weight than one that only lasted a few days.
The time frame you examine also matters. While support and resistance can be found on daily, weekly, and monthly charts, longer time frames tend to hold more importance. For instance, a monthly support level is generally more influential than one seen only on an intraday chart.
Take crude oil as an example: if it continuously bounces off $65 per barrel over several months, that price becomes a major support level. Similarly, if natural gas prices repeatedly fail to rise above $4.50 per million BTU, that resistance level becomes a critical area to watch.
To refine your analysis further, you can incorporate tools like trend lines and moving averages.
Trend Lines and Moving Averages
Moving averages are adaptive support and resistance tools that shift with price movements. Unlike static horizontal levels, they smooth out price fluctuations, making it easier to spot key trends. Moving averages below the current price act as support, while those above serve as resistance.
Common moving average periods include 9, 21, 50, 100, and 200 days. Each serves a different purpose depending on your trading style:
| Trading Style | Recommended Moving Averages | Best Use Case |
|---|---|---|
| Day Trading | 9/10 EMA, 21 EMA, 50 EMA | Quick trend signals |
| Swing Trading | 20/21 SMA, 50 SMA, 200/250 SMA | Tracking longer-term trends |
The 200-day moving average is particularly noteworthy. Since 1960, the S&P 500 has spent 70% of its time above this average, a figure that has risen to 85% since 2010. Paul Tudor Jones, a renowned trader, highlights its importance:
"My metric for everything I look at is the 200-day moving average of closing prices... If you use the 200-day moving average rule, then you get out. You play defense, and you get out."
Trend lines, on the other hand, connect key highs and lows in price action. For a trend line to be valid, prices must touch it at least three times. The more times a trend line holds, the stronger it becomes as a support or resistance level.
You can also layer moving averages of different lengths to identify both shallow and deeper levels of support and resistance. This approach gives a clearer picture of where significant buying or selling might occur.
Swing Points and Round Number Levels
In addition to historical data and moving averages, swing points and round numbers offer valuable insights. Swing highs and swing lows are some of the most reliable areas for identifying support and resistance. These points represent key moments where market sentiment shifted. Swing highs occur at price peaks before a pullback, while swing lows mark price bottoms before a rebound.
Swing points are especially useful because they reflect actual decision-making by traders, often involving significant trading volume.
Round numbers, like $50, $75, or $100 per barrel for oil or $2,000 per ounce for gold, also play a big role. These levels often act as psychological barriers. Many traders, especially less experienced ones, tend to place buy or sell orders at round numbers. Institutional investors and banks often set their target prices or stop orders at these levels as well.
The clustering of orders around round numbers creates natural zones of support and resistance. These levels can halt or reverse price movements due to the sheer concentration of activity.
When marking swing points, use the horizontal line tool on your trading platform to connect significant highs or lows. Keep in mind that these levels represent zones rather than precise prices, so allow for some flexibility when prices approach them.
How to Trade Using Support and Resistance
Once you’ve pinpointed key support and resistance levels, it’s time to use them to make informed trading decisions. These levels act as a guide for smarter trades, whether you’re dealing with commodities like crude oil, gold, or natural gas.
Finding Better Entry and Exit Points
Support and resistance levels are crucial for identifying potential entry and exit points in the market. The general idea is to buy near support levels when prices are likely to bounce higher and sell near resistance levels when a drop is expected.
For instance, when a commodity’s price approaches a support level, it often signals a buying opportunity, as previous buyers are likely to return at familiar price points. Take West Texas Intermediate (WTI) crude oil, for example. If it consistently rebounds from $70 per barrel over several months, hitting that level again could indicate a good entry point for a long position. However, instead of jumping in immediately, traders often wait for confirmation signals, such as increased trading volume, bullish chart patterns, or oversold momentum indicators.
On the flip side, resistance levels are key for deciding when to exit. If you’re holding a long position in gold and the price nears a well-established resistance level, say $2,100 per ounce, it might be a good time to lock in profits. If gold breaks through that resistance with strong volume, it could signal the start of a lasting uptrend.
Breakouts at these levels are also important signals. A price breaking above resistance may suggest further gains, while a break below support could indicate a deeper decline. For example, in mid-July 2024, if crude oil fell below a long-standing support level with heavy trading volume, it could confirm bearish momentum, signaling an opportunity to take a short position.
In addition to entry and exit strategies, managing risk is just as critical, and that’s where stop-loss orders come into play.
Setting Stop-Loss Orders at Key Levels
Support and resistance levels are essential for placing stop-loss orders, which are a key part of risk management. When buying near support, it’s wise to set a stop-loss just below that level. For example, if you buy natural gas at $3.20 per million BTU near a support level of $3.15, placing a stop-loss at $3.10 can help limit your losses if the price drops further.
Similarly, for short positions near resistance, setting a stop-loss slightly above the resistance level can protect against unexpected price spikes. For instance, if you’re shorting crude oil near a resistance level of $85 per barrel, placing a stop-loss at $87 allows some room for normal price fluctuations while safeguarding your capital.
This disciplined approach not only limits potential losses but also gives traders the flexibility to adjust stop-loss orders as market conditions shift.
Reading Market Direction
Support and resistance levels do more than just help with timing trades - they also offer insights into market trends and sentiment. These levels can indicate where trends might pause or reverse. For example, consistent bounces off a support level can confirm an uptrend, while multiple rejections at a resistance level might signal strong selling pressure and a potential downtrend.
The more frequently a price tests a support or resistance level, the more reliable that level becomes. For instance, if crude oil repeatedly finds support at $70 per barrel across several trading sessions, it strengthens the credibility of that level.
Breakouts often provide the clearest signals about market direction. A well-established support level breaking could signal the beginning of a significant downward move, while a resistance level giving way might mark the start of a sustained rally. For example, if natural gas consistently bounces off an uptrend line, it reinforces the line’s role as a strong support.
To enhance your trading decisions, combine support and resistance analysis with other technical tools like volume, momentum oscillators, and moving averages. These additional indicators can provide stronger confirmation when testing or breaking key levels.
Using Real-Time Data for Better Analysis
Timing is everything when it comes to analyzing support and resistance levels in commodity trading. Acting on fresh, real-time data versus outdated information can be the difference between seizing a profitable trade and watching an opportunity slip away.
Why Real-Time Data Matters
Commodity markets are incredibly fast-paced, with prices that can shift in mere seconds. Real-time data allows traders to identify support and resistance breaks as they occur - when they are most actionable. Waiting even a few hours can mean missing the window to act, as the market may have already moved significantly.
For instance, when crude oil breaks through a key resistance level at $80 per barrel, traders with immediate access to this information can quickly adjust their strategies. They might set new stop-loss orders, enter breakout trades, or reposition entirely. On the other hand, traders relying on delayed data may only discover the breakout after prices have surged, leaving them at a disadvantage. The impact of such delays is well-documented, with significant missed opportunities and potential losses reported in industry data.
Beyond trading decisions, real-time data is critical for managing risk. Rapid price movements can expose traders to unexpected credit or market risks. Having instant access to live data allows teams to monitor and manage these exposures effectively. This growing reliance on real-time data is reflected in the industry, where 51% of IT leaders now rank real-time data streaming platforms as a top strategic priority.
Fortunately, tools that deliver live data directly into analysis workflows are becoming more accessible, making this immediacy achievable for traders.
Getting Price Data with OilpriceAPI
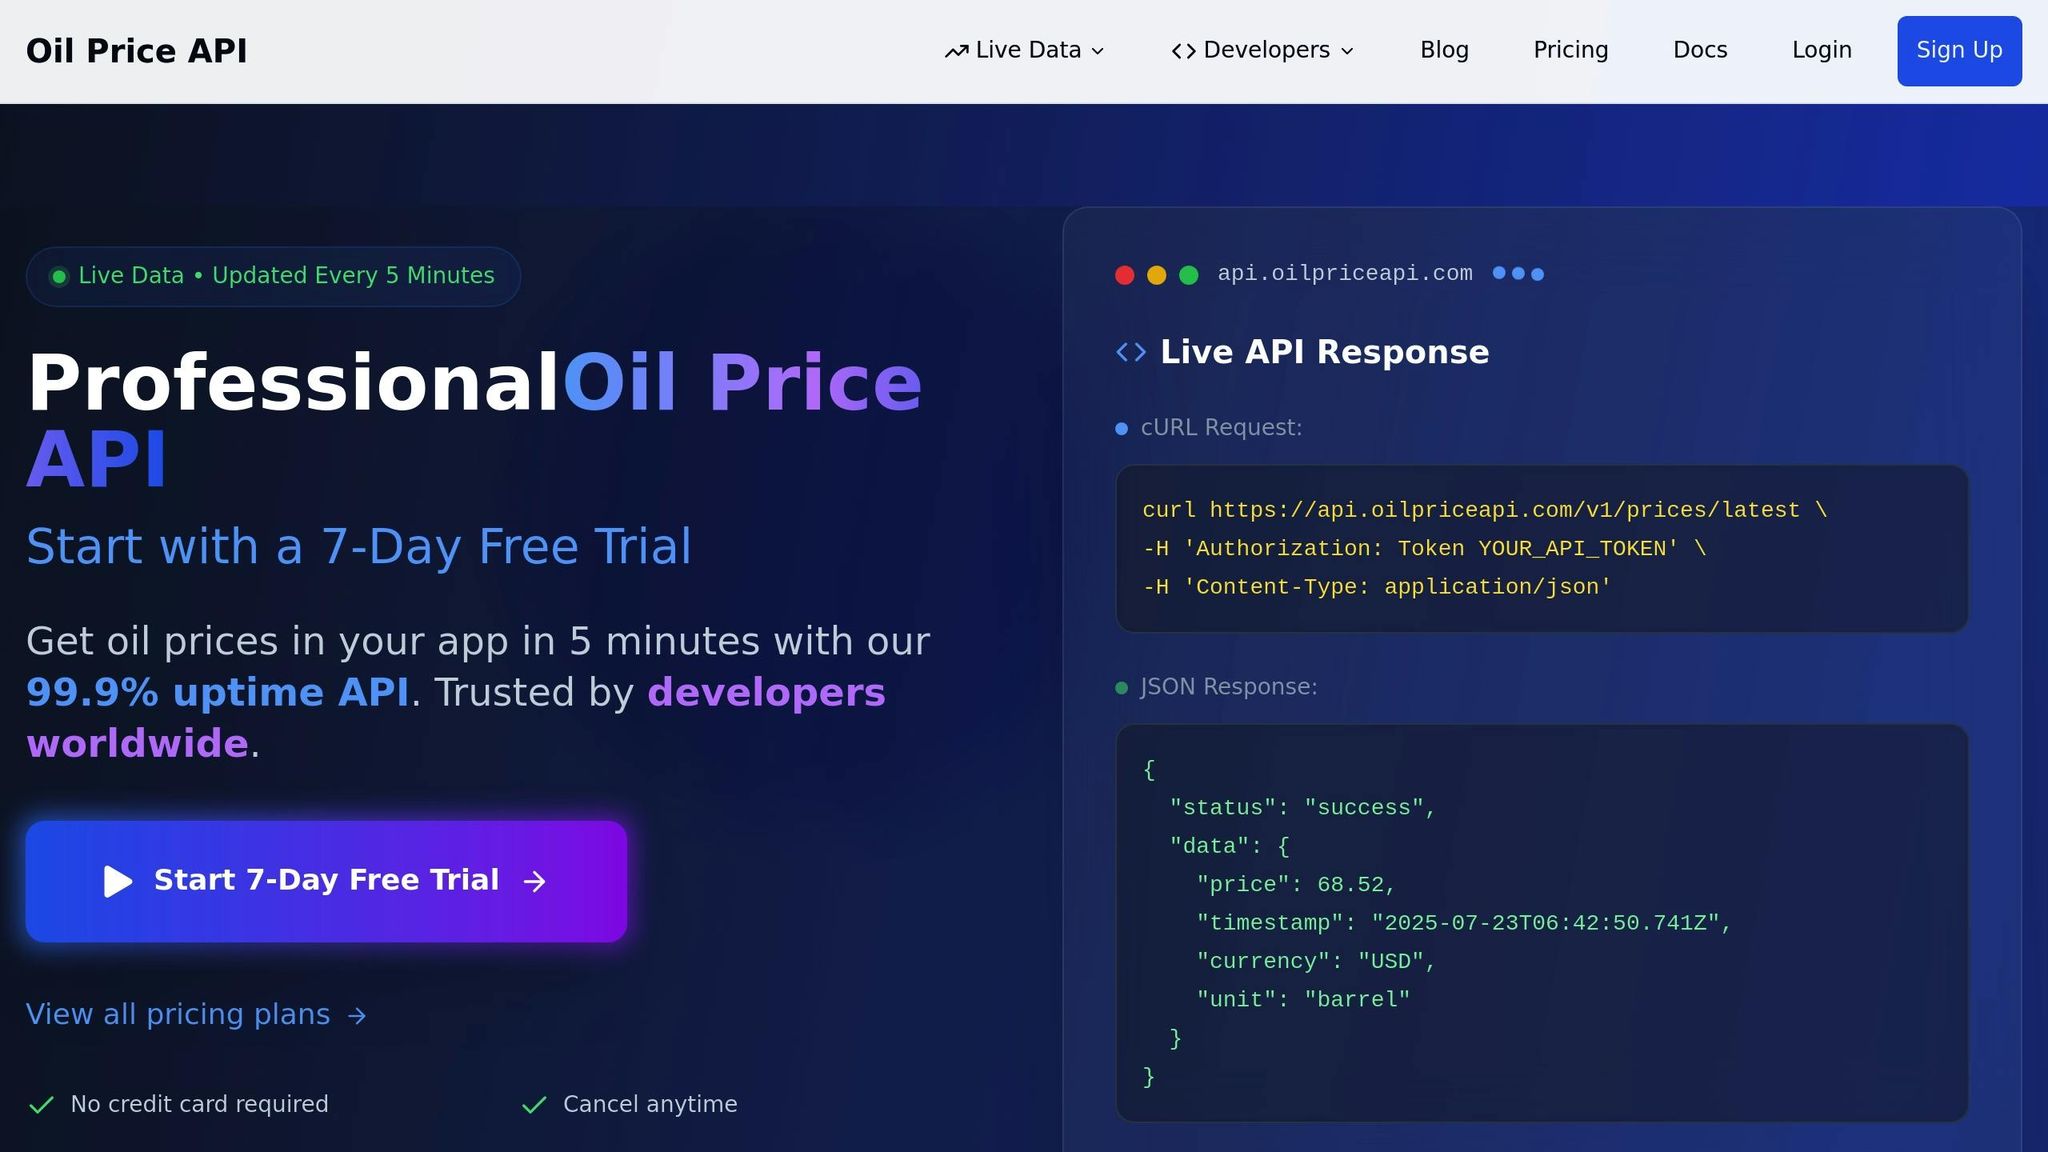
To harness the power of real-time insights, OilpriceAPI offers a straightforward solution. It provides real-time and historical price data for commodities like Brent Crude, WTI, Natural Gas, and Gold through a simple JSON REST API. This centralized access to market data streamlines the analysis process.
The API’s simplicity and reliability make it invaluable. Instead of manually checking multiple websites for current prices, traders can integrate OilpriceAPI directly into their existing workflows. For example, if you're tracking whether WTI crude is holding above a critical support level at $75 per barrel, a single API call provides instant access to the latest pricing data, making your analysis faster and more precise.
OilpriceAPI also offers endpoints for both real-time and historical data. This dual functionality is crucial for effective support and resistance analysis, as it allows traders to assess current market conditions while also examining past price behavior. By combining these insights, traders can validate key levels and make informed decisions when timing is most critical.
With seamless integration into trading systems, spreadsheets, or custom applications, OilpriceAPI removes the technical barriers to accessing real-time commodity data. Whether you're analyzing natural gas prices during volatile winter months or tracking gold's movements amid economic uncertainty, having accurate, up-to-date data at your fingertips ensures your analysis is as effective as possible.
sbb-itb-a92d0a3
Best Practices for Support and Resistance Analysis
Seasoned traders rely on specific strategies to refine their analysis and steer clear of costly mistakes when evaluating support and resistance levels.
Checking Multiple Time Frames
Top traders never limit themselves to just one chart when analyzing support and resistance. Instead, they use multiple time frames to get a broader and more precise view of the market - from identifying major trends to pinpointing exact entry and exit points.
Start with the highest time frame, such as weekly or monthly charts, to identify the overall market trend and key support and resistance areas. These charts provide a bigger picture and tend to highlight more reliable levels since they capture significant price movements and major trading decisions.
Next, shift to a medium time frame, like daily charts, to spot specific trading setups, such as consolidation patterns or intermediate levels that align with the broader trend. Finally, use the lowest time frame, such as 4-hour or hourly charts, to confirm precise entry or exit points while filtering out short-term market noise.
For instance, traders analyzing crude oil charts found that weekly charts outlined the overarching trend, daily charts revealed consolidation zones, and 4-hour charts pinpointed optimal entry points.
The secret is consistency - stick to one or two time frame combinations until you master them, rather than constantly switching approaches. Once you’ve established a multi-time frame perspective, adjust your levels as the market evolves.
Updating Levels as Markets Change
Support and resistance levels aren’t static - they shift as markets move. When a level is breached, it’s essential to update your analysis. Pay attention to how often a price tests a particular level. Frequent testing can either strengthen or weaken its significance.
For example, the Hang Seng Index repeatedly tested the same support level in November 2023 and January 2024 without breaking below it, signaling strong buying interest. Similarly, the iShares Russell 2000 ETF (IWM) encountered resistance at $200 multiple times, with each rejection reinforcing $200 as a critical barrier.
Take Apple (AAPL) as another case: analysts identified a trendline by connecting several key low points throughout the year. Each time the price approached this line, it rebounded, confirming it as a support level. However, if the price were to break below the trendline, traders would need to identify new support levels based on the latest price action.
This process highlights the dynamic nature of markets. Using a mix of techniques - such as peaks and troughs, moving averages, and trendlines - can help identify accurate support and resistance levels while also signaling when these levels might lose their reliability.
Mixing Technical Analysis with Market Psychology
Support and resistance levels aren’t just technical - they’re deeply influenced by trader behavior. Understanding market psychology can give you a significant edge. These levels often form due to the collective emotions of fear and greed driving trading decisions.
Round numbers, for example, hold strong psychological importance. Traders naturally focus on key thresholds like $50, $75, or $100 per barrel for oil, and these levels often become self-fulfilling as more participants watch them. When crude oil nears $80 per barrel, trading activity typically spikes as traders react to this psychological marker.
Candlestick patterns near critical levels also offer insight into market sentiment. For instance, a long lower wick at a support level may suggest sellers pushed prices down, but buyers came in strongly to defend the level. On the other hand, small-bodied candles near resistance might indicate indecision among traders.
"In the short run, the market is a voting machine, but in the long run, it is a weighing machine." - Benjamin Graham
To act on psychological signals, wait for confirmation using tools like RSI, MACD, or volume analysis. When technical indicators align with psychological cues, the chances of a successful trade increase.
Finally, keep an eye on market sentiment and major news events. During periods of uncertainty, emotions can make support and resistance levels more volatile. In calmer times, these levels tend to hold more consistently as rational analysis takes precedence.
Conclusion: Using Support and Resistance in Commodity Markets
Support and resistance analysis is a cornerstone of successful commodity trading, offering traders a structured way to make timely decisions in unpredictable markets. By understanding how these levels function as price barriers, traders can better anticipate market movements and identify optimal entry and exit points.
The real power of support and resistance trading comes from blending various techniques. Using historical data, trend lines, moving averages, and psychological price levels together creates a more accurate and reliable framework. This approach minimizes the risk of falling for false signals, which can be costly in the fast-paced world of commodity trading.
Real-time data is equally critical. Support and resistance levels shift as market conditions change, and staying updated is essential. Tools like OilpriceAPI provide traders with the most current data, enabling them to adjust their strategies on the fly and refine their analysis to align with evolving market dynamics.
"Support and resistance are key concepts in technical analysis. They refer to price levels acting as barriers, guiding market direction. These levels help traders make informed decisions on entry/exit points." - Ioan Smith, Expert Financial Writer
Applying these concepts effectively requires discipline and adaptability. Markets are fluid, and a level that served as strong support yesterday can easily become resistance once breached. Successful traders continuously monitor market behavior, adjust their strategies, and incorporate an understanding of market psychology to stay ahead.
Using multi-timeframe analysis, supported by additional technical indicators, further strengthens the reliability of these levels. For instance, a breakout in commodity prices, confirmed by increased trading volume, underscores the validity of support and resistance signals. This principle holds true across various commodities, reinforcing the need for volume confirmation and a layered approach to analysis.
FAQs
How can traders use real-time data to better analyze support and resistance levels in commodity markets?
Traders can use real-time commodity price data to pinpoint and evaluate support and resistance levels by monitoring live price movements, chart patterns, and essential technical indicators like moving averages. These tools play a crucial role in identifying key price zones, making it simpler to detect potential reversals or breakouts.
Keeping your analysis updated with precise, up-to-the-minute data sharpens decision-making for entry and exit points, enabling you to respond swiftly to market shifts. This method strengthens trading strategies and keeps you competitive in the ever-changing commodity markets.
How do psychological factors, like round numbers, influence support and resistance levels in commodity trading?
The Role of Psychological Factors in Commodity Trading
Psychological influences, like round numbers, heavily impact how support and resistance levels form in commodity trading. Numbers such as $50.00 or $100.00 often hold symbolic importance for traders and investors, prompting heightened buying or selling activity near these price points.
This tendency creates natural barriers in the market. Many participants set their orders around these key figures, causing commodity prices to frequently pause, reverse direction, or consolidate when they approach these levels. Round numbers, in essence, become critical thresholds that shape market behavior.
How can traders use moving averages to identify support and resistance levels in volatile commodity markets?
Moving averages are a handy tool for traders, helping them pinpoint dynamic support and resistance levels by smoothing out the ups and downs of price movements. In fast-moving markets, prices often respond to these averages, either bouncing off them or breaking through.
The 200-day moving average is particularly popular for gauging long-term trends and often serves as a strong barrier or support. For a shorter-term perspective, traders frequently turn to the 50-day moving average to identify temporary support or resistance zones. Beyond just the numbers, traders pay attention to the slope and the distance between moving averages. These details can reveal market momentum and hint at possible price reversals. By weaving moving averages into their approach, traders can navigate the unpredictable world of commodity markets with greater confidence.