
Latency Optimization: Sierra Chart with Teton Routing
Explore latency optimization strategies with streamlined trading systems for ultra-fast execution in dynamic markets.
Read More →Stay informed with the latest market analysis, price trends, and industry insights from our commodity trading experts.
286 articles • Updated weekly with fresh insights
Explore latency optimization strategies with streamlined trading systems for ultra-fast execution in dynamic markets.
Read More →
Explore essential legal clauses for API rate limiting policies to protect your service, ensure compliance, and promote fair usage among users.
Read More →
Learn how to create a robust commodity compliance training program that meets regulatory demands and enhances risk management in trading.
Read More →
Explore essential APIs for real-time commodity data integration, enabling smarter decision-making and streamlined workflows in various industries.
Read More →
Explore the challenges and solutions of integrating nanotechnology in gas extraction water treatment, from costs to regulatory hurdles.
Read More →
Explore reliable government sources for historical commodity data, covering energy, agriculture, and minerals, and their practical applications.
Read More →
Sustainability reporting is crucial for commodity traders by 2025, driven by regulations, market demands, and technology advancements.
Read More →
Explore the essential features and top APIs for accessing customizable commodity data in 2025, ensuring traders and analysts stay competitive.
Read More →
Explore how hybrid models enhance commodity price forecasting by combining statistical methods and machine learning for improved accuracy and insights.
Read More →
Explore how centralized and distributed market data systems handle rising data demands, weighing their scalability, costs, and performance.
Read More →
Explore how auto-hedging revolutionizes risk management in commodity trading, offering speed, efficiency, and precision over manual methods.
Read More →
Strengthen your API security with these 10 best practices for authentication, protecting sensitive data from cyber threats.
Read More →
Explore the differences between rate limiting and throttling in API management, essential for ensuring stable performance during traffic spikes.
Read More →
Explore the differences between free and paid commodity data sources, focusing on accuracy, timeliness, and reliability for traders and analysts.
Read More →
Learn how ADX signals can enhance your gold trading strategy by measuring trend strength and providing insights for better decision-making.
Read More →
Explore how Role-Based Access Control (RBAC) enhances security and efficiency when integrated with API gateways for managing user permissions.
Read More →
Explore essential tools and techniques for API gateway logging, focusing on efficiency, security, and compliance in high-traffic environments.
Read More →
Learn how client-side throttling in JSON REST APIs can prevent rate limit violations, enhance user experience, and maintain real-time data reliability.
Read More →
Learn essential practices for effective API audit logging to enhance security, ensure compliance, and improve operational reliability.
Read More →
Explore top APIs for building custom commodity dashboards, featuring real-time data and U.S.-specific insights for various commodities.
Read More →
Explore the top 5 APIs for customized commodity data, offering real-time updates and tailored analytics for various industries.
Read More →
Real-time data APIs are revolutionizing food price monitoring, enabling faster decision-making and enhanced food security responses.
Read More →
Explore how ETRM software simplifies energy trading, enhances risk management, and ensures compliance in volatile markets.
Read More →
Explore how gold's role as a safe-haven asset differed during the 2008 financial crisis and the 2020 pandemic recession, revealing key insights for investors.
Read More →
Commodity price volatility significantly influences counterparty credit risk, affecting contract values and liquidity across financial markets.
Read More →
Explore the potential of Microbial Enhanced Gas Recovery as a cost-effective and environmentally friendly alternative to traditional gas extraction methods.
Read More →
Explore the key differences between inverse and leveraged ETFs, their risks, uses, and why they are best suited for short-term strategies.
Read More →
Explore how political stability influences commodity prices, revealing key metrics and tools for informed market decisions.
Read More →
Explore how Bayesian models enhance commodity price forecasting through probabilistic predictions and real-time data integration.
Read More →
Understanding gold price seasonality can enhance investment strategies, revealing optimal buying and selling periods throughout the year.
Read More →
Explore how automation is revolutionizing natural gas extraction, enhancing efficiency, safety, and environmental sustainability in the industry.
Read More →
Explore the differences between RMSE and MAE metrics for evaluating prediction models, and learn how to choose the right one for your needs.
Read More →
Learn how to integrate Brent Crude pricing into BI tools with key API features, benefits, and evaluation factors for informed decision-making.
Read More →
Explore how AI enhances seasonal inventory forecasting with real-time data and advanced models to optimize supply and meet consumer demand.
Read More →
Learn how to accurately calculate the Average Directional Index (ADX) for gold trading and improve your market analysis with reliable data.
Read More →
Explore how WebSocket technology revolutionizes real-time data delivery in commodity markets, enhancing speed, efficiency, and decision-making.
Read More →
Explore how real-time data and advanced technologies enhance reservoir management, improving decision-making and operational efficiency.
Read More →
Understanding commodity price cycles is essential for investors navigating the complexities of boom, bust, and recovery phases in volatile markets.
Read More →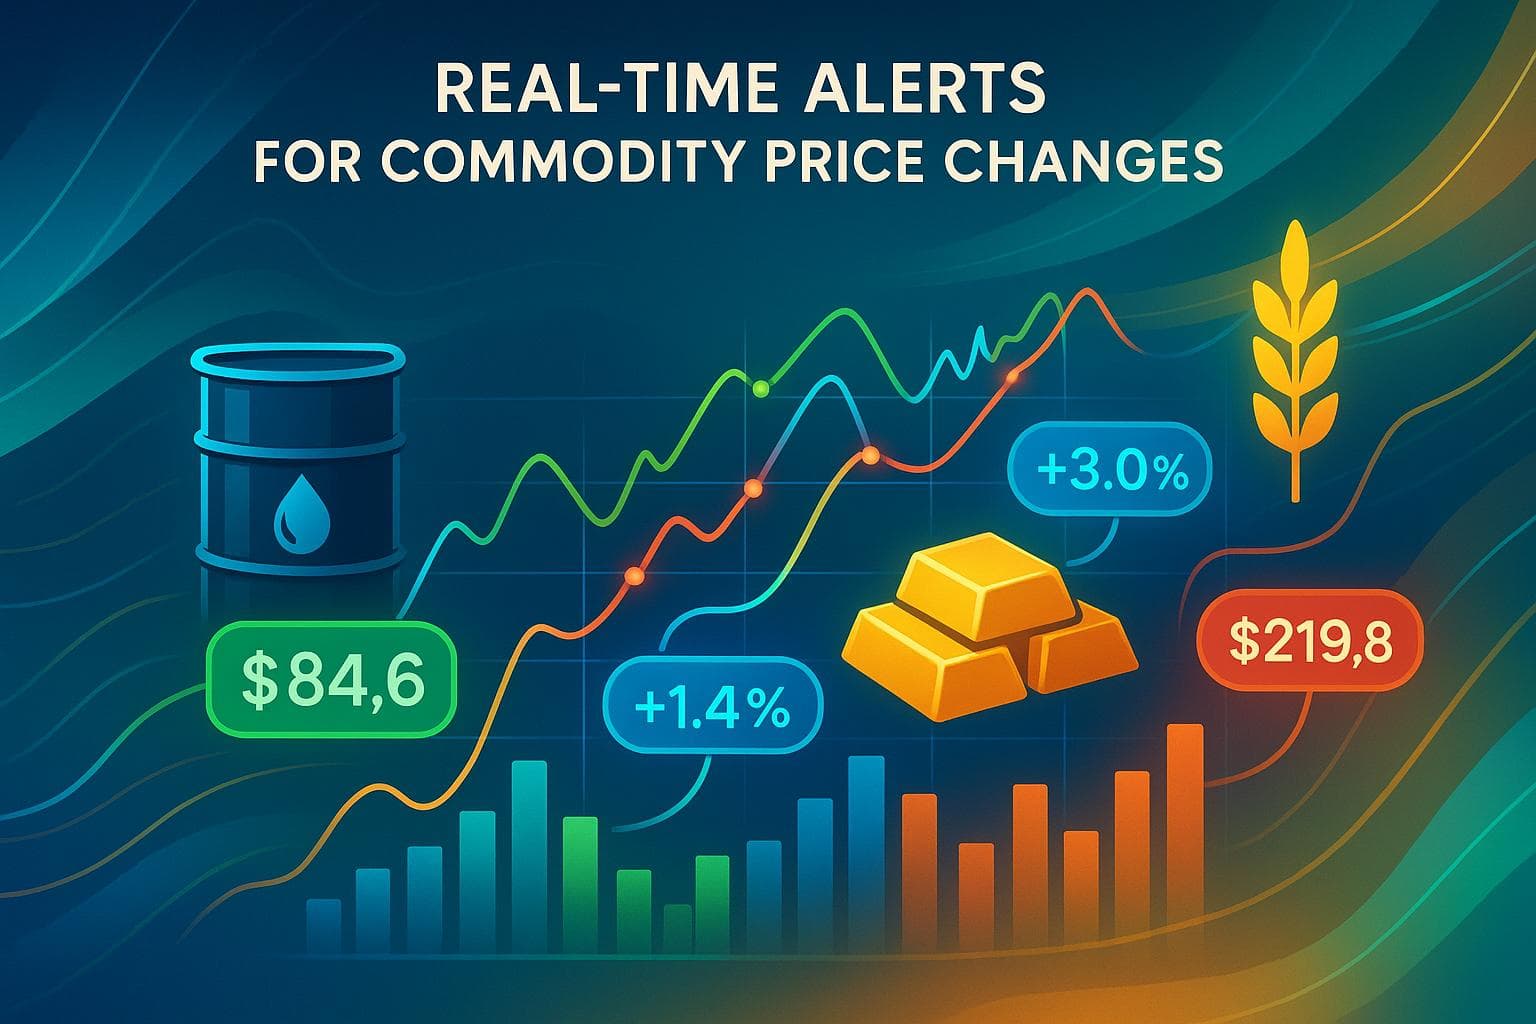
Real-time alerts offer businesses a competitive edge in commodity markets by providing instant updates, improving accuracy, and reducing costs.
Read More →
Explore the contrasting methane emission regulations between the US and EU, and their impact on natural gas markets and international trade.
Read More →
ASEAN's gold demand significantly influences global prices through cultural practices, economic shifts, and trading dynamics across markets.
Read More →
Explore the top nano-sensors revolutionizing reservoir characterization, offering precise insights into subsurface conditions and enhancing recovery strategies.
Read More →
Explore leading cloud platforms that deliver low-latency data feeds essential for real-time commodity trading and decision-making.
Read More →
Explore how commodity APIs streamline trading systems by providing real-time data, enhancing integration, and ensuring compliance for better decision-making.
Read More →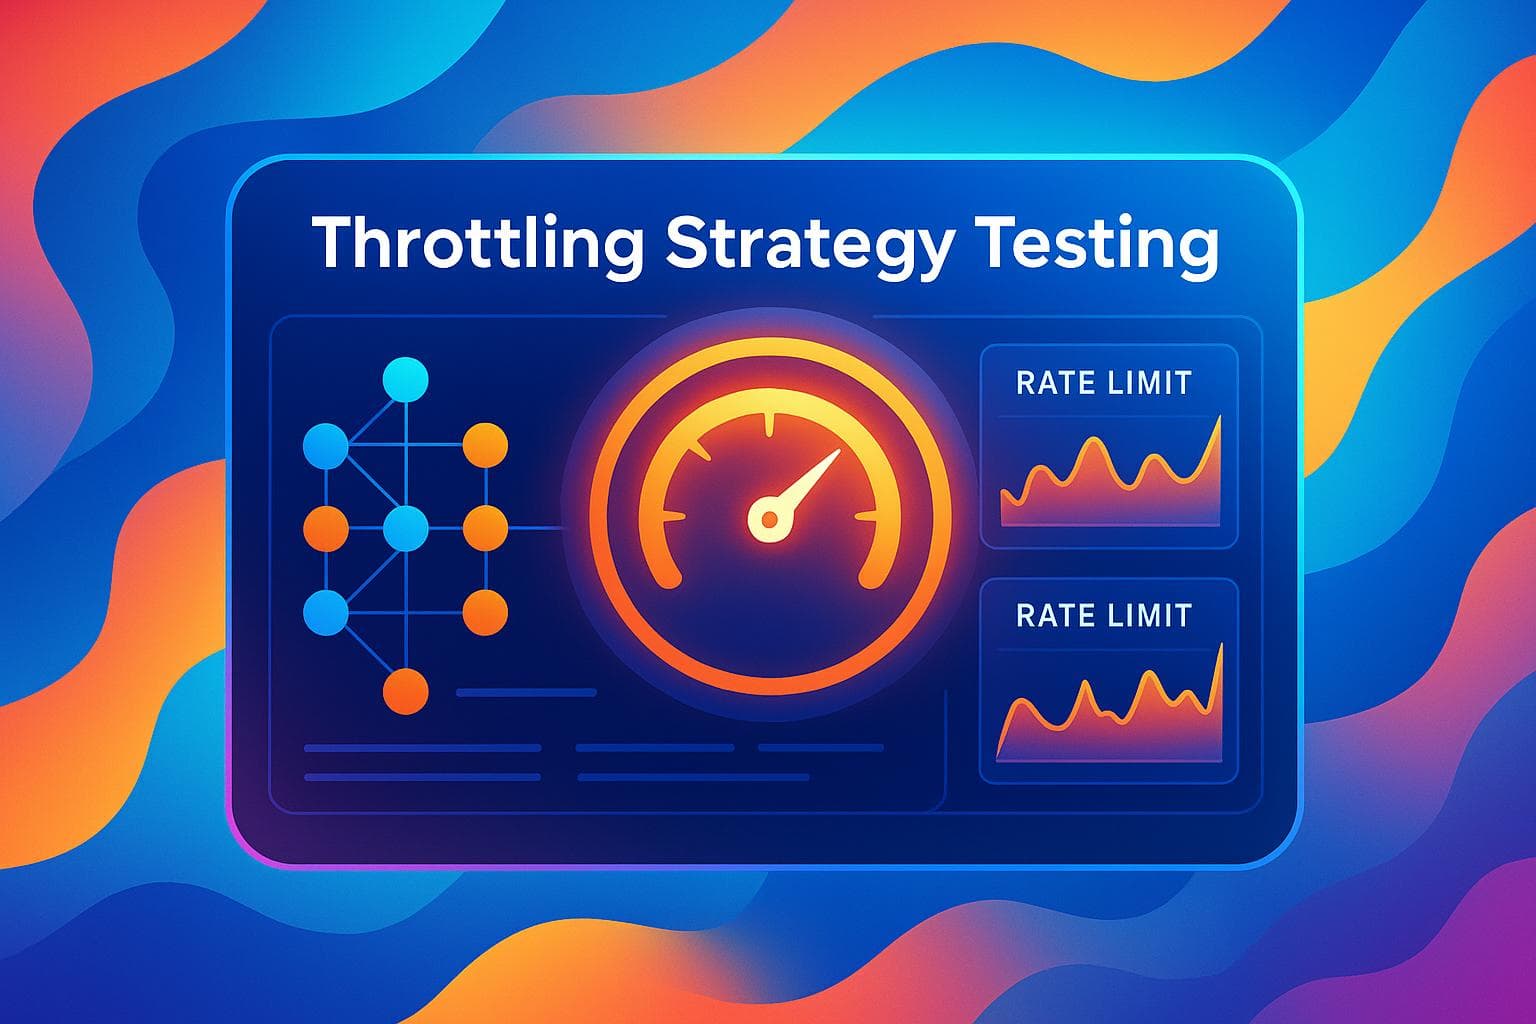
Explore effective throttling strategies for APIs, ensuring stability, compliance, and optimal performance under heavy traffic conditions.
Read More →
Explore how commodity APIs provide real-time data for effective decision-making in volatile markets, enhancing risk management and procurement strategies.
Read More →
Explore effective pagination strategies for REST APIs handling large commodity datasets, ensuring optimal performance and user experience.
Read More →
Learn how to effectively set ADX indicators for gold trading based on market trends, improving your trading strategies for both trending and range-bound conditions.
Read More →
Learn how to effectively use the MACD indicator for trading gold and oil, including strategies, configurations, and risk management tips.
Read More →
Explore how dynamic machine learning models are revolutionizing commodity price forecasting, overcoming the limitations of traditional methods.
Read More →
Understand how economic growth cycles impact commodity prices and the role of real-time data in navigating market fluctuations.
Read More →
BRICS nations are reshaping the global gold market by increasing reserves and developing alternative trading systems, challenging Western dominance.
Read More →
Explore the essential features of commodity price APIs, including real-time updates, historical data access, and customizable feeds for traders and analysts.
Read More →
Explore top APIs for trade compliance that automate checks, provide real-time data, and simplify global trade regulations.
Read More →
Wettability alteration using nanoparticles can significantly enhance gas production by optimizing fluid-rock interactions in reservoirs.
Read More →
Explore how sanctions reshape oil contracts, emphasizing compliance practices that enhance market stability and avoid legal pitfalls.
Read More →
Learn how to optimize cloud latency in commodity trading to seize opportunities and maximize profits with advanced hardware and real-time monitoring.
Read More →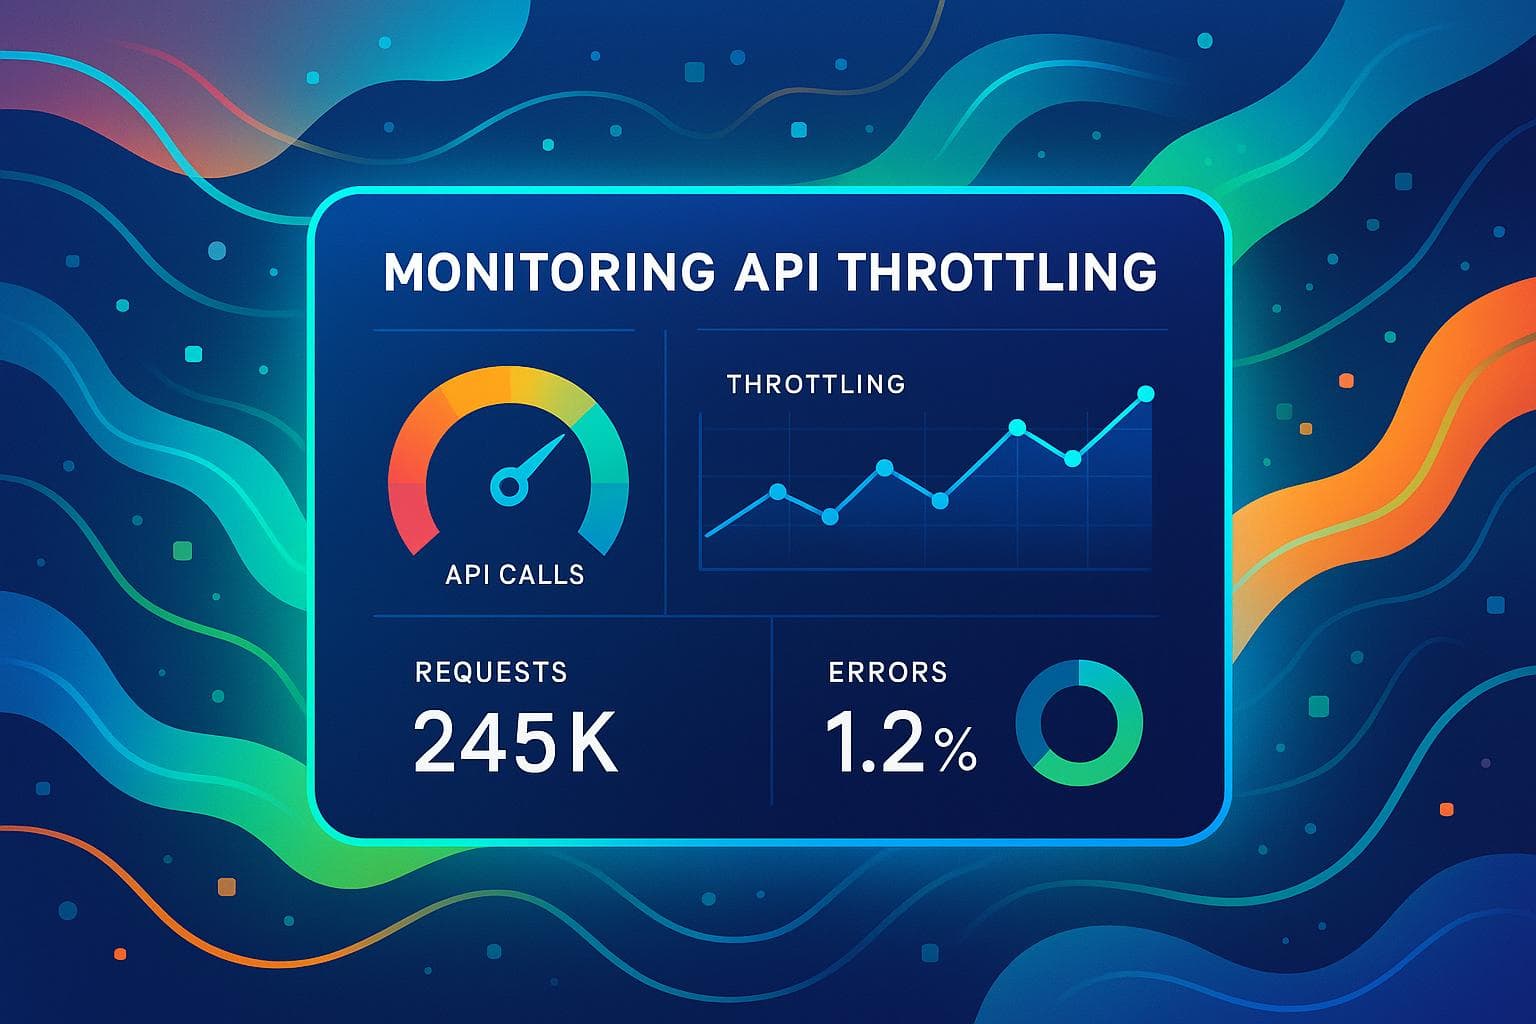
Explore essential metrics and tools for monitoring API throttling to enhance performance and ensure system reliability.
Read More →
Explore the complexities of HazMat certification for natural gas in the U.S. and Canada, highlighting key regulatory differences and compliance strategies.
Read More →
Learn how to optimize costs with commodity APIs by managing requests, implementing caching, and monitoring usage effectively.
Read More →
Learn how to effectively manage API rate limits during seasonal traffic spikes to ensure system stability and fair access for all users.
Read More →
Optimize your large repositories with compression techniques to enhance performance, reduce storage costs, and streamline workflows.
Read More →
API audit trails are crucial for maintaining data integrity, preventing tampering, and ensuring compliance across industries such as finance and healthcare.
Read More →
Explore the top five technical indicators for commodity trading, including RSI, MACD, and Bollinger Bands, to enhance your market analysis.
Read More →
Explore the key factors driving price volatility in lithium and cobalt markets, from supply chain disruptions to evolving government policies.
Read More →
Understand essential KPIs for backend systems to enhance performance, reliability, and user satisfaction while preventing downtime.
Read More →
Explore the importance of real-time data APIs for enhancing machine learning models in volatile markets like commodities and trading.
Read More →
Explore the principles of ethical penetration testing, including legal compliance, data handling, and best practices for securing APIs and sensitive systems.
Read More →
Explore how gold serves as a safe haven during economic crises, analyzing its historical significance and investment strategies for uncertain times.
Read More →
Explore the evolution of India's gold consumption from 2010 to 2024, influenced by cultural practices, economic conditions, and government policies.
Read More →
Explore how edge computing and centralized systems shape low-latency trading, enhancing speed, scalability, and security for financial institutions.
Read More →
Explore essential rate limiting techniques for commodity APIs to maintain reliability and performance during market volatility and high demand.
Read More →
Explore the top APIs for tracking regional commodity prices, offering real-time data for energy, metals, and agriculture to optimize market strategies.
Read More →
Explore how load balancing enhances the performance and reliability of real-time market data feeds, ensuring swift responses during trading surges.
Read More →
Explore how subscription APIs enhance ERP systems with real-time commodity pricing, boosting accuracy and decision-making capabilities.
Read More →
Learn how support and resistance levels guide trading decisions in commodity markets, helping identify key entry and exit points.
Read More →
Learn how to create automated price alerts for commodities using JSON APIs, ensuring you stay informed on market changes in real-time.
Read More →
Real-time health monitoring enhances safety for gas workers by utilizing wearable devices, IoT sensors, and cloud platforms to prevent hazards and ensure compliance.
Read More →
Explore the evolving correlation between gold prices and stock indices, examining historical trends, market dynamics, and investment strategies.
Read More →
Access reliable real-time and historical commodity data with a 7-day free trial, ideal for traders, businesses, and developers.
Read More →
Learn how sub-200ms response times from an oil price API can enhance trading apps, enabling faster execution and improved risk management.
Read More →
Explore how real-time data and drilling intelligence empower energy traders to make informed decisions in volatile markets.
Read More →
Access live oil prices effortlessly with a simple setup, real-time updates, and easy integration for informed decision-making.
Read More →
Explore a reliable oil price API that offers real-time data, 99.9% uptime, and robust security, empowering businesses in the energy sector.
Read More →
Explore how APIs enhance trade compliance for commodities through real-time data, automation, cost savings, and improved security.
Read More →
Explore how commodity price fluctuations impact employment cycles across sectors and regions, influencing economic trends and job markets.
Read More →
Explore key providers of historical renewable energy data, comparing their strengths, accessibility, and pricing to inform your research and decision-making.
Read More →
Explore the significance of natural gas storage reports in shaping market dynamics, price trends, and trading strategies in the energy sector.
Read More →
Explore the cost, compliance, and performance differences among HFO, VLSFO, and MGO fuels in maritime operations and their impact on ROI.
Read More →
Explore the dynamics of Henry Hub pricing, its influence on natural gas markets, and how traders manage risks in an ever-changing landscape.
Read More →
Effective developer support is crucial for successful integration of commodity APIs, influencing project outcomes and reducing integration time.
Read More →
Understand the new marine fuel regulations for 2025, options for compliance, and strategies to manage costs and risks effectively.
Read More →
Explore the advancements in nanoparticle-assisted oil recovery, comparing mathematical and machine learning models for enhanced efficiency.
Read More →
Explore the intricate relationship between metal prices and stock markets, highlighting key drivers like economic conditions and central bank actions.
Read More →
Explore how economic growth influences Brent and WTI oil prices, highlighting the differences in global and domestic market dynamics.
Read More →
Explore the legal frameworks governing commodity derivatives in the U.S., including key regulations, enforcement, and compliance strategies.
Read More →
Explore how advancements in seismic imaging are revolutionizing energy exploration, reducing costs, and minimizing environmental impact.
Read More →
Explore the importance of interoperability in commodity APIs, highlighting solutions for seamless data integration and real-time updates.
Read More →
Explore the critical role of REST API authentication in safeguarding financial services against rising cyber threats and ensuring regulatory compliance.
Read More →
Explore gold's price evolution from the 1970s to the 2020s, revealing its role as a safe-haven asset during economic turmoil.
Read More →
APIs empower finance teams by providing real-time and historical commodity price data, enabling smarter decision-making in volatile markets.
Read More →
Learn how feature engineering enhances solar energy forecasting by integrating time and weather data for improved accuracy and efficiency.
Read More →
Learn effective strategies for horizontal scaling and load balancing to enhance application performance and reliability under heavy traffic.
Read More →
Explore how oil prices and renewable energy are interconnected through market trends, policy impacts, and investment shifts.
Read More →
Learn essential strategies for designing effective API access control policies to safeguard against rising security threats.
Read More →
Real-time data empowers investors to enhance diversification strategies, adapt to market changes, and manage risks effectively in volatile environments.
Read More →
Explore how APIs enhance commodity risk management through real-time data access, automation, and advanced analytics for informed decision-making.
Read More →
Understand how real-time APIs can help businesses monitor tariff impacts on commodity prices for smarter decision-making.
Read More →
Explore key considerations for designing data-driven financial apps, focusing on API selection, integration challenges, and user experience.
Read More →
Explore the intricate relationships between commodity cycles and stock market performance across various sectors, and learn investment strategies to navigate them.
Read More →
Learn how to effectively optimize API rate limits for scalability, ensuring reliable performance even during traffic spikes.
Read More →
Explore how blockchain enhances regulatory compliance in commodity trading through secure records, real-time audits, and automated processes.
Read More →
Explore the significance of low-latency APIs in real-time trading, their benefits, challenges, and solutions for optimizing performance.
Read More →
Learn how to enhance your Sierra Chart indicators by integrating external data for better market analysis and decision-making.
Read More →
Explore the top 7 commodity APIs for real-time market data across energy, agriculture, and metals to enhance your trading decisions.
Read More →
Learn essential steps for risk assessment in natural gas operations, focusing on safety, compliance, and efficient management of hazards.
Read More →
Learn how to effectively test API scalability in microservices by monitoring key metrics, using the right tools, and optimizing performance strategies.
Read More →
Explore how carbon pricing is reshaping commodity markets, impacting energy, metals, and agriculture while driving a shift towards sustainability.
Read More →
Explore the top 5 APIs for real-time Brent Crude and WTI data, offering reliable insights for traders and analysts to make informed decisions.
Read More →
Learn how to securely authenticate with the Sierra Chart API, troubleshoot common issues, and implement best practices for safe access.
Read More →
Explore how real-time pricing APIs are revolutionizing pricing strategies across industries, enhancing competitiveness and profitability.
Read More →
Explore how commodity prices influence stock markets, driven by economic factors, global events, and investment tools for smarter trading strategies.
Read More →
User feedback is key to refining financial dashboards, improving clarity, usability, and real-time data delivery for better decision-making.
Read More →
Explore how reward functions enhance decision-making in commodity trading by balancing profit and risk through precise data and optimization strategies.
Read More →
Explore how regional stock markets respond to oil price fluctuations, revealing opportunities and risks for investors across the globe.
Read More →
Explore the top industries driving gold demand, from electronics and medical equipment to jewelry and finance, highlighting gold's unique properties.
Read More →
Explore how transportation costs and storage levels at Cushing, Oklahoma, impact the Brent-WTI crude oil price spread and global market dynamics.
Read More →
Real-time price APIs are crucial for businesses to monitor market volatility caused by sanctions, enabling informed decisions and risk management.
Read More →
Understand how volume analysis enhances gold trading strategies by revealing market trends, sentiment, and optimal trading timings.
Read More →
Integrate real-time commodity prices into your trading strategies using JSON APIs in MetaTrader 4 for smarter decisions.
Read More →
Explore how transparency in cross-border oil trade enhances compliance, reduces fraud, and streamlines operations amidst regulatory challenges.
Read More →
Explore how commodity prices serve as key indicators for inflation, guiding businesses in making informed economic decisions.
Read More →
Explore how Monte Carlo simulation enhances commodity pricing by modeling price scenarios, assessing risk, and improving decision-making.
Read More →
Explore the essentials of commodity data feed APIs for real-time pricing, integration tips, and benefits across various industries.
Read More →
Understand forward contracts and CFTC compliance to effectively manage commodity trading risks while ensuring legal adherence.
Read More →
Explore the vital role of PRAs in oil price transparency, challenges they face, and how modern tools are reshaping market data access.
Read More →
Explore the differences between WTI and Brent Crude oil, including their characteristics, delivery methods, and the API features for real-time data tracking.
Read More →
Learn how to effectively manage commodity price risk through dynamic hedging strategies, real-time data monitoring, and risk analysis.
Read More →
Learn how schema mapping transforms real-time commodity data into standardized formats, enhancing accuracy and decision-making in trading.
Read More →
Explore how speculation influences commodity prices, affecting volatility, liquidity, and market dynamics while highlighting the importance of real-time data.
Read More →
Explore how AI enhances risk management in commodity trading with real-time data integration, price prediction, and automated decision-making.
Read More →
Explore the energy demands of CO2 removal technologies, their efficiencies, and the innovations driving advancements in climate solutions.
Read More →
Real-time data validation is crucial for ensuring accuracy in commodity APIs, impacting trading decisions and risk management.
Read More →
Explore essential credit risk tools for commodity trading, focusing on real-time data, analytics, and automated monitoring to enhance risk management.
Read More →
Learn how Pressure Swing Adsorption efficiently removes CO2 from natural gas, ensuring compliance with quality standards in gas processing.
Read More →
Explore how geospatial data enhances commodity price forecasting through advanced monitoring techniques and real-time insights across agriculture and energy sectors.
Read More →
Learn effective strategies for managing risks in volatile markets, including diversification, hedging, and leveraging real-time data.
Read More →
Understand the common compliance risks in commodity trading to avoid fines and ensure regulatory adherence with effective strategies.
Read More →
Explore how U.S. and global debt crises influence gold prices, revealing distinct patterns in market behavior during financial uncertainty.
Read More →
G7 and G20 sanctions on natural gas are reshaping global energy markets, highlighting differences in approach and the impact on energy security.
Read More →
Learn how to optimize real-time data throughput in APIs for improved performance, scalability, and business efficiency.
Read More →
Explore how policy gradient methods enhance trading strategies in volatile commodity markets by leveraging real-time data for improved decision-making.
Read More →
Learn essential API caching techniques to enhance performance, reduce costs, and ensure data reliability in your applications.
Read More →
Ensure your backend systems comply with security, data management, and performance standards to maintain reliability and protect sensitive information.
Read More →
Explore how LNG export rules shape U.S. natural gas prices through supply, demand, and regulatory changes, impacting both markets and economies.
Read More →
Sanctions are reshaping global natural gas exports, prompting countries to innovate with LNG and new trade routes amidst financial challenges.
Read More →
Learn how to enhance gold price predictions through effective feature engineering, utilizing economic indicators and technical metrics.
Read More →
Learn how to protect workers in the natural gas industry with essential PPE and regulatory compliance strategies.
Read More →
Learn key strategies for building fault-tolerant API systems, ensuring reliability and performance even during failures.
Read More →
Explore the ethical dilemmas surrounding AI-driven pricing algorithms, including bias, data privacy, and the need for transparency.
Read More →
Explore the essential features and benefits of metals commodity APIs, offering real-time data and insights for trading, risk management, and supply chain decisions.
Read More →
Learn essential API encryption methods and best practices to secure sensitive data, ensuring privacy and compliance with regulations.
Read More →
Explore how energy policies impact commodity prices through key metrics like energy use, carbon pricing, and EV adoption rates.
Read More →
Learn how Privileged Access Management protects APIs through secure authentication, credential management, and compliance strategies.
Read More →
Explore key rate limiting algorithms like Token Bucket, Leaky Bucket, and Sliding Window to manage traffic flow in distributed systems efficiently.
Read More →
Explore how global energy policies are influencing farming costs and food prices, affecting everything from crop use to market stability.
Read More →
Explore essential API security practices for CI/CD pipelines, including authentication, testing, monitoring, and compliance to safeguard your workflows.
Read More →
Explore essential tips for integrating the TradeStation API, focusing on security, performance, and effective error handling.
Read More →
Learn essential strategies to prevent API injection attacks and enhance your web application's security against common vulnerabilities.
Read More →
Explore how CTRM software integration enhances trading efficiency, offering solutions like API, middleware, and cloud-based systems.
Read More →
Explore how seasonal shifts, long-term cycles, and trading events shape commodity prices for more accurate market predictions.
Read More →
Explore the evolving landscape of global commodity trading regulation, its key players, and the impact on market participants and compliance.
Read More →
Learn how to manage API rate limits effectively with strategies that optimize calls, monitor usage, and prevent disruptions.
Read More →
Explore the critical differences between API security and compliance, their distinct goals, and how they integrate to protect sensitive data.
Read More →
Learn how to build an effective breach response plan that minimizes risks associated with third-party vendors and protects your organization.
Read More →
Integrate CQG API into your trading system with this comprehensive guide covering setup, security, market data access, and trade execution.
Read More →
Explore critical API security risks in commodity data services and discover effective strategies to safeguard sensitive market data.
Read More →
Explore how blockchain enhances security and efficiency in commodity trading, tackling fraud and improving transaction processes.
Read More →
Explore effective feature engineering techniques for enhancing oil price forecasting accuracy, integrating external data, and refining models.
Read More →
Learn how to use the Ichimoku Cloud to analyze gold prices, identify trends, and make informed trading decisions with key signals and tools.
Read More →
Explore how finance teams leverage APIs for secure access control, ensuring compliance and operational efficiency in a rapidly evolving regulatory landscape.
Read More →
Explore how gold serves as a reliable asset during economic crises, preserving wealth in hyperinflation, recessions, and market crashes.
Read More →
Explore the limitations of the ADX indicator in gold trading, including signal delays and market volatility, and learn how to enhance its effectiveness.
Read More →
Explore the top cloud tools for commodity risk management, featuring real-time data, advanced analytics, and seamless integration for businesses of all sizes.
Read More →
Explore how data licensing influences costs, access, and efficiency in commodity price APIs, and choose the best model for your business needs.
Read More →
APIs streamline commodity price data management, enabling real-time updates, reducing errors, and improving decision-making efficiency.
Read More →
Explore the key differences between the MACD line and signal line, essential tools for analyzing market trends and momentum in trading.
Read More →
Explore how AI is revolutionizing retail pricing, enhancing revenue, margins, and responsiveness to market dynamics.
Read More →
Explore the contrasting gold demands of India and China shaped by cultural traditions and economic factors, revealing unique market dynamics.
Read More →
Explore how data mapping for commodity APIs enhances trading decisions through accurate integration and market analysis.
Read More →
Explore how MACD can effectively analyze gold price trends, momentum shifts, and potential reversals using real-time data integration.
Read More →
Gold consistently rises during recessions, making it a key asset for protecting wealth in uncertain economic times.
Read More →
Explore essential strategies for backend security, including patch management, configuration management, and API protection to safeguard your systems.
Read More →
Explore the essential role of real-time data in automated trading systems for improved decision-making and risk management.
Read More →
Learn how dynamic rate limiting enhances API performance and security by adapting to real-time traffic needs and preventing misuse.
Read More →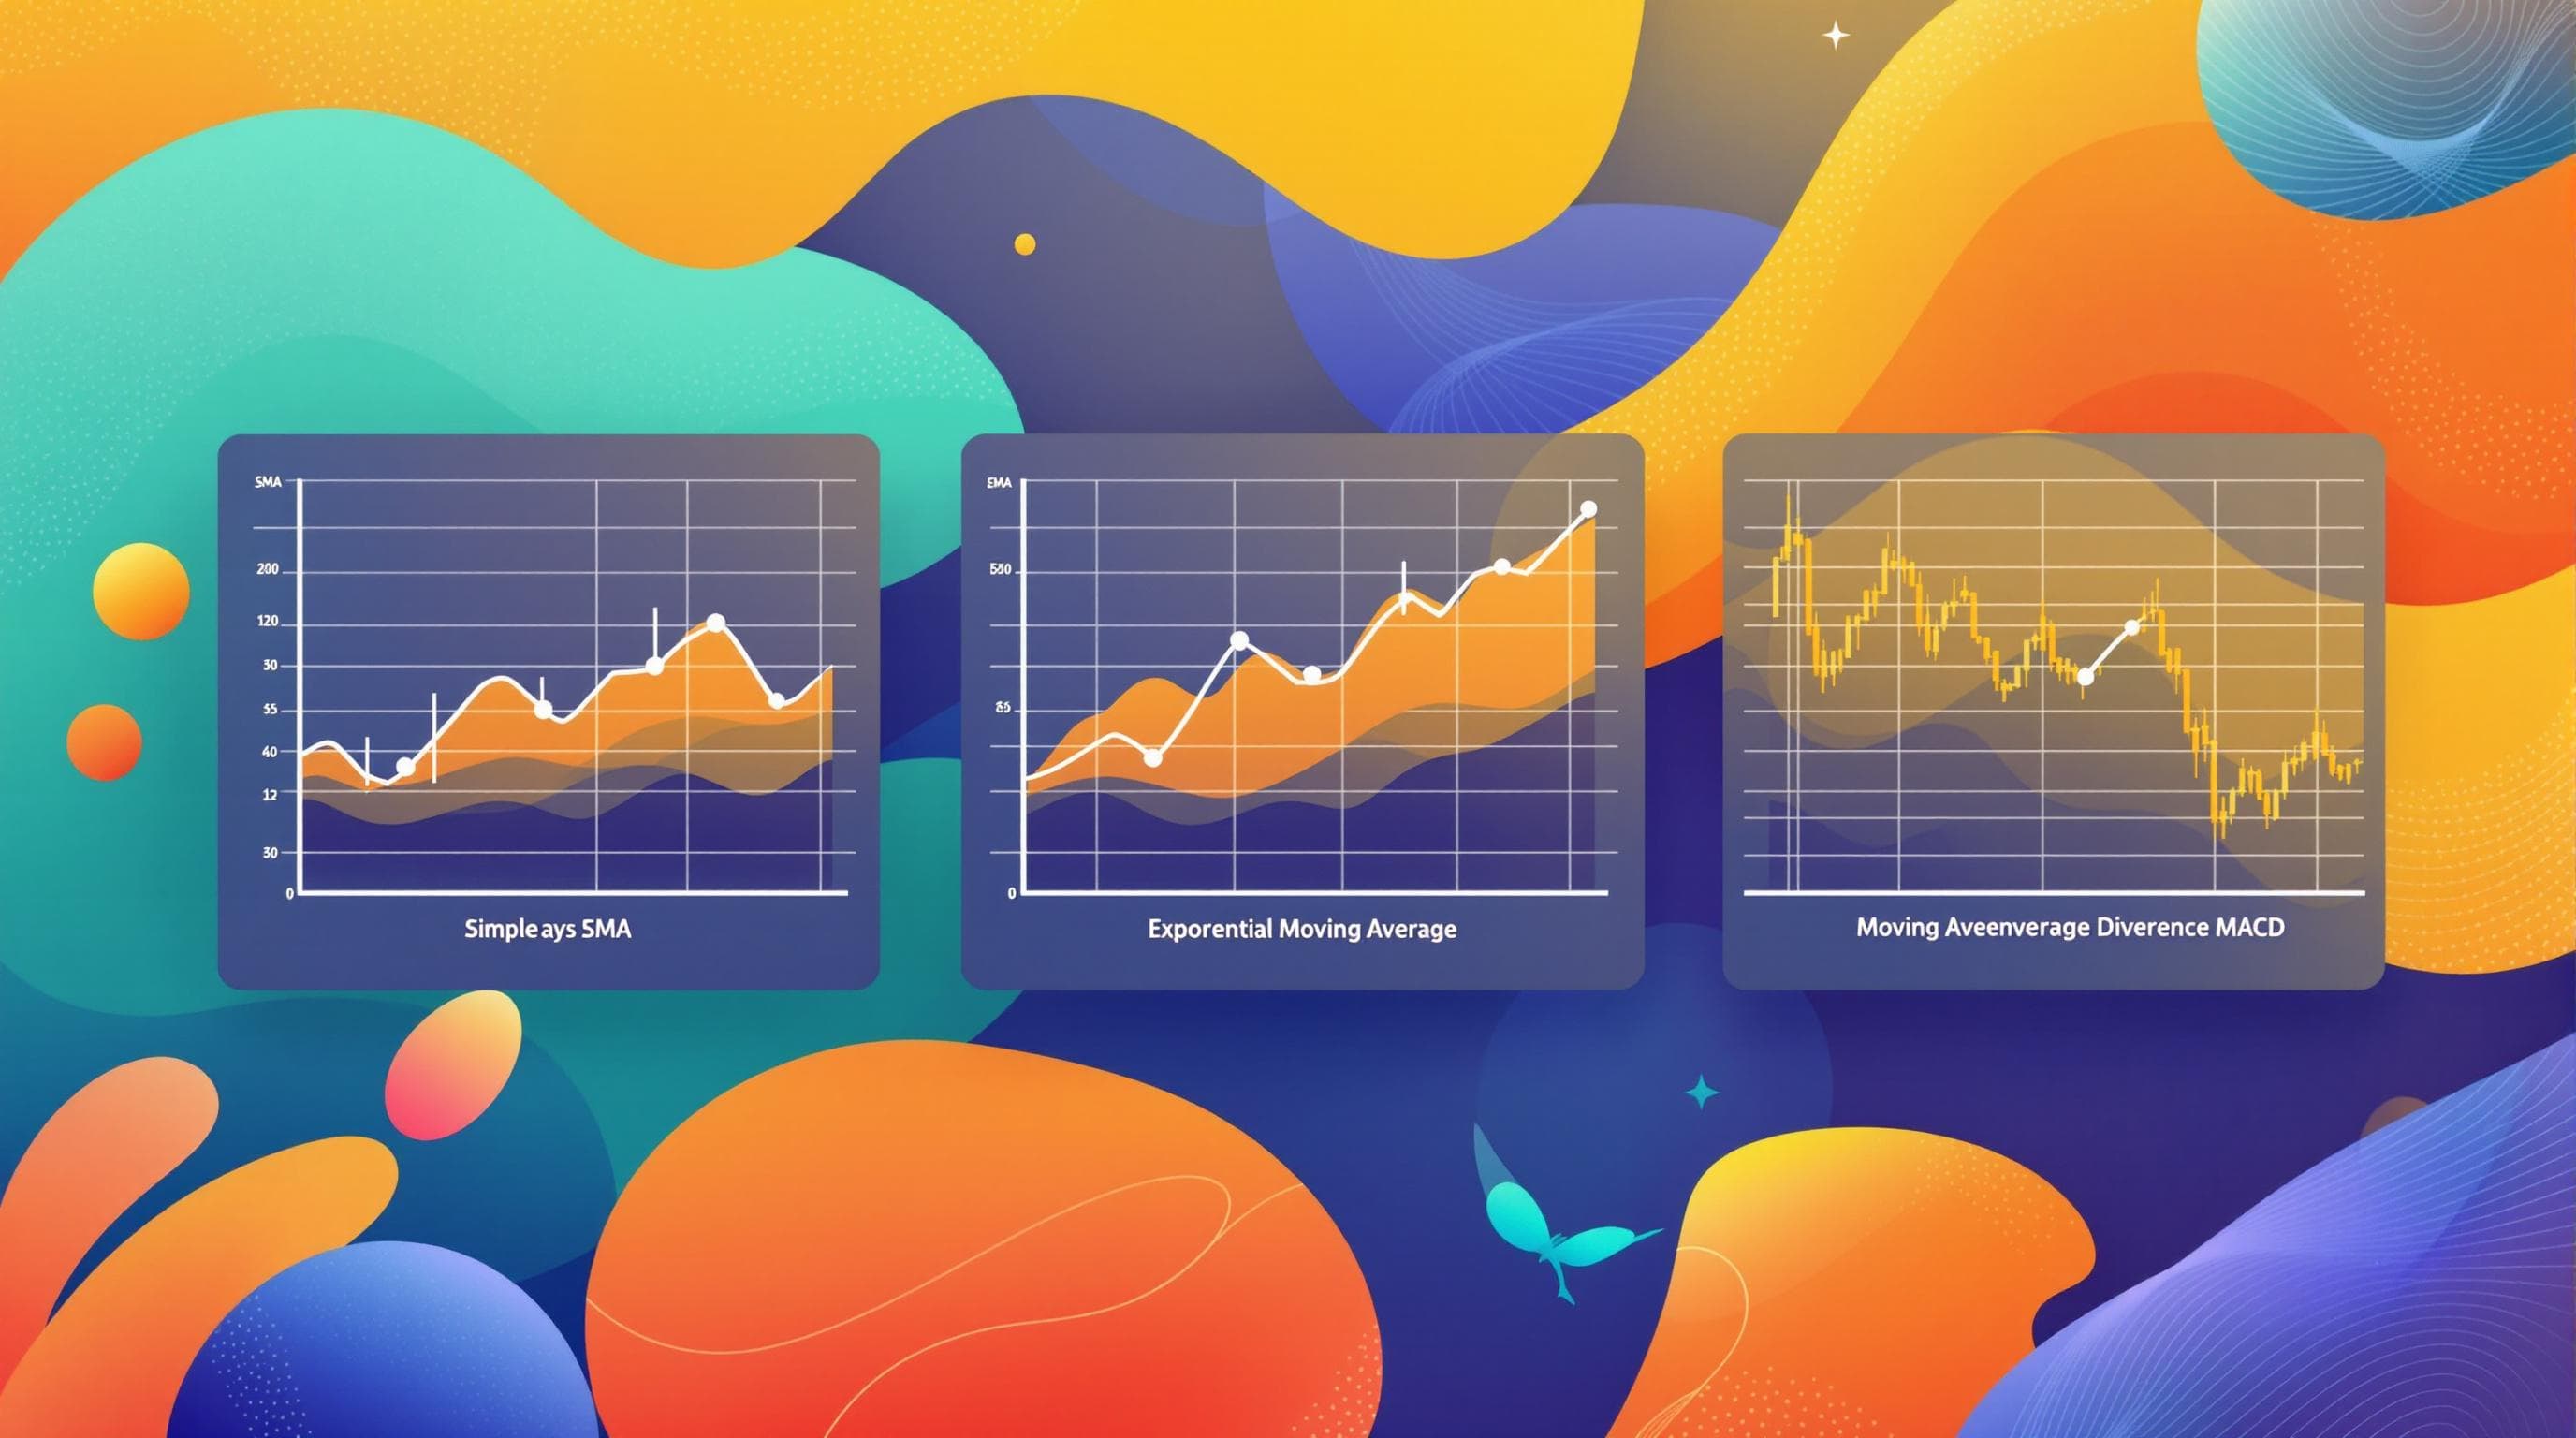
Explore three effective moving average strategies for forecasting oil prices, including SMA, EMA, and MACD, to enhance trading decisions.
Read More →
Learn effective techniques to optimize API calls for real-time commodity data, enhancing speed, reliability, and performance.
Read More →
Explore the fundamentals of Event-Driven Architecture, its benefits, challenges, and applications in real-time data processing across various industries.
Read More →
Explore the critical third-party risks in commodity trading, from data breaches to compliance failures, and learn effective management strategies.
Read More →
Explore five algorithms that effectively detect outlier movements in commodity prices, enhancing market monitoring and decision-making.
Read More →
Explore how real-time outlier detection enhances trading strategies and risk management in commodity markets through advanced analytics and machine learning.
Read More →
The Russia-Ukraine conflict has drastically affected global commodity prices, stock markets, and supply chains, creating uncertainty for investors.
Read More →
Geopolitical risks significantly influence commodity price volatility, necessitating strategic risk management for finance professionals.
Read More →
Explore how Protobuf enhances real-time commodity data transfer with smaller sizes, faster processing, and adaptable schemas for dynamic markets.
Read More →
Explore the speed and efficiency of Protobuf compared to JSON, uncovering their strengths and ideal use cases for data transfer.
Read More →
Explore how big data transforms financial forecasting, enhancing accuracy, risk management, and real-time decision-making for finance professionals.
Read More →
Explore how speculation influences price swings in precious metals and the strategies to manage associated risks.
Read More →
Explore how speculation drives gold market volatility, influenced by investor sentiment, supply-demand imbalances, and trading strategies.
Read More →
Explore how big data tools enhance commodity price forecasting through real-time data, AI, and advanced analytics for better decision-making.
Read More →
Explore the advantages of cloud-based commodity data for traders, including real-time access, scalability, automation, and advanced analytics.
Read More →
Explore how certification influences Brent Crude pricing, ensuring quality, market confidence, and stability in the global oil industry.
Read More →
The EPA's new methane rule mandates strict emission controls for natural gas, imposing compliance costs and operational changes to reduce emissions by 80%.
Read More →
Explore the EPA's new methane rules aimed at reducing emissions by 80% in the natural gas sector, detailing compliance steps and expected benefits.
Read More →
Learn how CFTC position limits regulate commodity trading, ensuring market stability and preventing manipulation while allowing for risk management.
Read More →
Explore how banking crises influence gold prices and the importance of real-time tracking for informed investment decisions.
Read More →
Gold prices surged 9.2% in Q1 2023 amid banking turmoil, highlighting its status as a safe-haven asset during financial crises.
Read More →
Explore how Weighted Moving Average enhances commodity price forecasting by balancing recent trends with historical data for better trading decisions.
Read More →
Explore the advantages of Weighted Moving Averages in trading, powered by APIs for real-time data and customizable analysis.
Read More →
Learn how commodities can protect your wealth against inflation by analyzing market trends and utilizing real-time data for informed investment strategies.
Read More →
Explore essential commodity price APIs that provide vital data for inflation risk analysis, helping organizations make informed decisions.
Read More →
Learn how real-time log analysis enhances commodity price API performance, ensuring accurate data and quick issue resolution during market fluctuations.
Read More →
Learn how to implement sliding window counters for effective API rate limiting, ensuring stability and fair access while managing traffic bursts.
Read More →
Explore the sliding window counter method for API rate limiting, ensuring stability and fair usage while preventing overload and malicious traffic.
Read More →
Effective API logging is essential for regulatory compliance and security, focusing on best practices and industry-specific needs.
Read More →
Understand key requirements for API logging to ensure compliance with regulations like PCI DSS, GDPR, and HIPAA while enhancing security.
Read More →
Explore how regulations shape oil pricing dynamics, influencing Brent Crude and WTI through historical and modern market factors.
Read More →
Explore the compliance challenges faced by Brent and WTI oil markets, focusing on regulations, environmental risks, and the need for global cooperation.
Read More →
Learn how continuous monitoring enhances regulatory compliance in commodity trading through key tools and strategies for effective risk management.
Read More →
APIs enhance third-party risk monitoring by automating data collection, providing real-time insights, and improving security and compliance.
Read More →
Explore the essential differences between real-time and historical data in commodity markets and their impact on trading strategies.
Read More →
Explore best practices for integrating commodity data APIs to enhance decision-making, data security, and market analysis for your business.
Read More →
Learn effective techniques to protect JSON APIs from XSS attacks, including input validation, output encoding, and content-type enforcement.
Read More →
Explore how speculation shapes energy prices, driving volatility and influencing market behavior in oil and gas trading.
Read More →
Explore how currency fluctuations, particularly the US dollar, impact global commodity prices and the factors influencing this relationship.
Read More →
Explore the critical differences between real and nominal prices, their impact on purchasing power, and how to make informed financial decisions.
Read More →
Explore how sentiment analysis influences commodity prices, combining market insights with economic data for better trading strategies.
Read More →
Learn essential steps for implementing REST API auditing to enhance security and ensure compliance with industry standards.
Read More →
Explore the differences between Brent and WTI crude oil prices, their historical trends, and the factors influencing their market dynamics.
Read More →
Explore the impact of natural gas storage levels on market trends and pricing, with insights into regional variations and seasonal patterns.
Read More →
Explore the essential features and top providers of petrochemical data APIs for better market insights and decision-making in a growing industry.
Read More →
Explore the top 5 commodity price APIs for 2024, offering real-time and historical data to help businesses make informed market decisions.
Read More →
Learn how the Token Bucket Algorithm effectively manages API rate limiting, ensuring stability and fair resource distribution during traffic spikes.
Read More →
Learn essential steps for effective natural gas emergency response, from identifying risks to coordinated evacuations and ongoing training.
Read More →
Explore the contrasting behaviors of gold and stocks during economic crises, revealing their roles as safe havens and growth assets.
Read More →
Explore essential practices for securing APIs in 2024, addressing common vulnerabilities and ensuring data protection.
Read More →
Learn how to use RSI for gold trading to identify buying and selling opportunities with technical analysis strategies.
Read More →
Interest rates significantly influence commodity derivative prices, affecting storage costs, trading behavior, and currency values.
Read More →
Explore the factors driving gold price volatility, from global events to supply and demand dynamics, and learn how to navigate these trends effectively.
Read More →
Learn how to implement API audit logging for security, compliance, and troubleshooting, including best practices and essential features.
Read More →
Explore the relationship between gold prices and inflation in 2024, including insights on central bank activities and market trends.
Read More →
Explore the volatile natural gas market in 2024, driven by geopolitical tensions, supply chain disruptions, and evolving pricing strategies.
Read More →
Explore five effective feature engineering methods that enhance machine learning model accuracy for commodity trading.
Read More →
Discover how real-time data APIs can transform your oil trading strategies. Learn to access accurate, up-to-the-minute data on oil futures and indexes to boost profitability and stay ahead in the competitive oil market.
Read More →
Explore essential API session management best practices to enhance security, prevent unauthorized access, and safeguard user data effectively.
Read More →
Explore how geopolitical risks influence oil price volatility, from supply disruptions to demand shifts, and learn strategies to manage these impacts.
Read More →
Explore 10 essential MFA best practices for API security in 2024, ensuring robust protection against automated attacks and data breaches.
Read More →
Explore how oil price shocks impact inflation across global economies and the varying effects on rich and developing countries.
Read More →
Explore the strengths and weaknesses of neural networks and time series models in commodity forecasting. Learn how to optimize your predictions.
Read More →
Discover essential hedging strategies to protect your business from volatile commodity prices and ensure stable cash flow in uncertain markets.
Read More →
Discover the top 7 sources for timber market data in 2024, helping you track prices and trends effectively for smart decision-making.
Read More →
Explore the differences between JSON and XML as API data formats, including their strengths, weaknesses, and best use cases for integration.
Read More →
Learn essential practices to protect your APIs from DDoS attacks, ensuring robust security and minimizing service disruptions.
Read More →
Explore how central bank policies influence gold prices, including interest rates, economic uncertainty, and market trends.
Read More →
Discover how AI is reshaping commodity sentiment analysis, enhancing risk management, and improving trading decisions while highlighting its limitations.
Read More →
Explore how military conflicts impact energy markets, causing price volatility, supply disruptions, and a renewed focus on energy security.
Read More →
Discover the best mobile apps for tracking real-time commodity prices, features to consider, and tips for safe trading on the go.
Read More →
Explore gold's complex relationship with inflation over the past century, revealing its role in investment strategies during economic uncertainty.
Read More →
Discover essential API testing tools and techniques to ensure software reliability, performance, and security in your applications.
Read More →
Explore the Black-Scholes model, its history, applications, pros and cons, and its ongoing relevance in modern finance.
Read More →
Discover how central banks influence gold prices through interest rates, money supply, and economic policies. Learn key investment tips.
Read More →
Discover how currency fluctuations affect gold prices, including the impact of the U.S. dollar, Euro, and emerging economies on the gold market.
Read More →
Discover how news sentiment impacts commodity prices and explore strategies to navigate the challenges in trading effectively.
Read More →
Discover the top 10 commodity price apps for 2024, featuring tools for traders, investors, and beginners to stay informed in the commodity market.
Read More →
Explore the regional differences in natural gas prices across the US in 2024, driven by supply, demand, weather, and infrastructure.
Read More →
Explore how CPI data influences gold prices in 2024, including expert predictions and key market factors driving trends.
Read More →
Discover essential API rate limiting best practices for 2024, ensuring stability, security, and user satisfaction in your systems.
Read More →
Discover best practices for preventing API security misconfigurations in 2024 and ensure robust protection against data breaches.
Read More →
Discover best practices for integrating commodity APIs with trading platforms to enhance efficiency, security, and trading strategies.
Read More →
Explore the top real-time futures data APIs of 2024, comparing features, coverage, pricing, and more to enhance your trading strategies.
Read More →
Explore how gold recycling is transforming the market, balancing supply and demand while benefiting the environment and driving innovation.
Read More →
Discover the top commodity data APIs for finance professionals in 2024. Compare features, pricing, and trends to find the right fit for your needs.
Read More →
Explore gold's role as a hedge against currency devaluation, comparing it with treasury bonds and other precious metals for investment strategies.
Read More →
Discover how Fibonacci retracement can enhance your gold trading strategy by identifying key price levels and combining with other analysis tools.
Read More →
Discover how geopolitical tensions influence gold prices and learn investment strategies to navigate these turbulent times.
Read More →
Understand the differences between API latency and response time, their impact on performance, and strategies to optimize them for better user experience.
Read More →
Discover how retail pricing APIs transform pricing strategies, boost sales, and enhance market agility in 2024.
Read More →