How Economic Growth Cycles Shift Commodity Prices
How Economic Growth Cycles Shift Commodity Prices
Economic growth cycles directly influence commodity prices. When economies expand, demand for resources like oil, gold, and natural gas rises, pushing prices higher. During slowdowns, reduced demand typically lowers prices. However, factors such as supply disruptions, geopolitical conflicts, or monetary policy changes can cause unexpected price movements.
Key takeaways:
- Growth fuels demand: Expanding economies increase demand for commodities, raising prices.
- Slowdowns reduce demand: Economic downturns often lead to price drops.
- Exceptions to the rule: Supply chain issues or geopolitical events can drive prices higher even during slowdowns.
- Data matters: Combining historical data with real-time insights is essential for understanding trends.
For businesses and investors, tools like OilpriceAPI simplify access to both historical and real-time commodity data, enabling smarter decisions. Whether you're analyzing past trends or tracking current market shifts, understanding these patterns is crucial for navigating volatile markets.
1. Historical Price Records
Historical Relevance
Looking back at how commodities have behaved over time can offer a glimpse into what might come next. Take the 1973–1974 Arab oil embargo, for instance. Crude oil prices skyrocketed from roughly $3.00 to about $12.00 per barrel as supply disruptions and geopolitical tensions shook global economies. Fast forward to the early 2000s, when the dot-com bubble burst, and investors sought refuge in assets like gold, which steadily gained value during the uncertainty. Then there was the 2008 financial crisis, where oil and natural gas prices plummeted after hitting peak levels. These moments underline how historical price movements can help us understand and anticipate future trends.
Data Accessibility
Accessing historical commodity data has never been easier. Government agencies and financial institutions now offer a wealth of information, and platforms like OilpriceAPI bring it all together. They provide a unified view of historical pricing across commodities, making it simple to compare trends quickly and accurately. Combine this historical data with real-time updates from tools like OilpriceAPI, and you’ve got a powerful resource for navigating today’s unpredictable markets.
Usefulness for Analysis
Connecting past trends with current economic conditions creates a solid foundation for managing risks. For example, analysts can spot correlations by comparing macroeconomic indicators with commodity price movements. Economic growth often drives up energy demand, leading to higher crude oil prices, while downturns tend to increase volatility and highlight seasonal price patterns. These insights are incredibly valuable for portfolio managers and industries alike, whether they’re crafting risk management strategies or negotiating supply contracts. Historical records don’t just tell a story - they provide actionable insights for smarter decision-making.
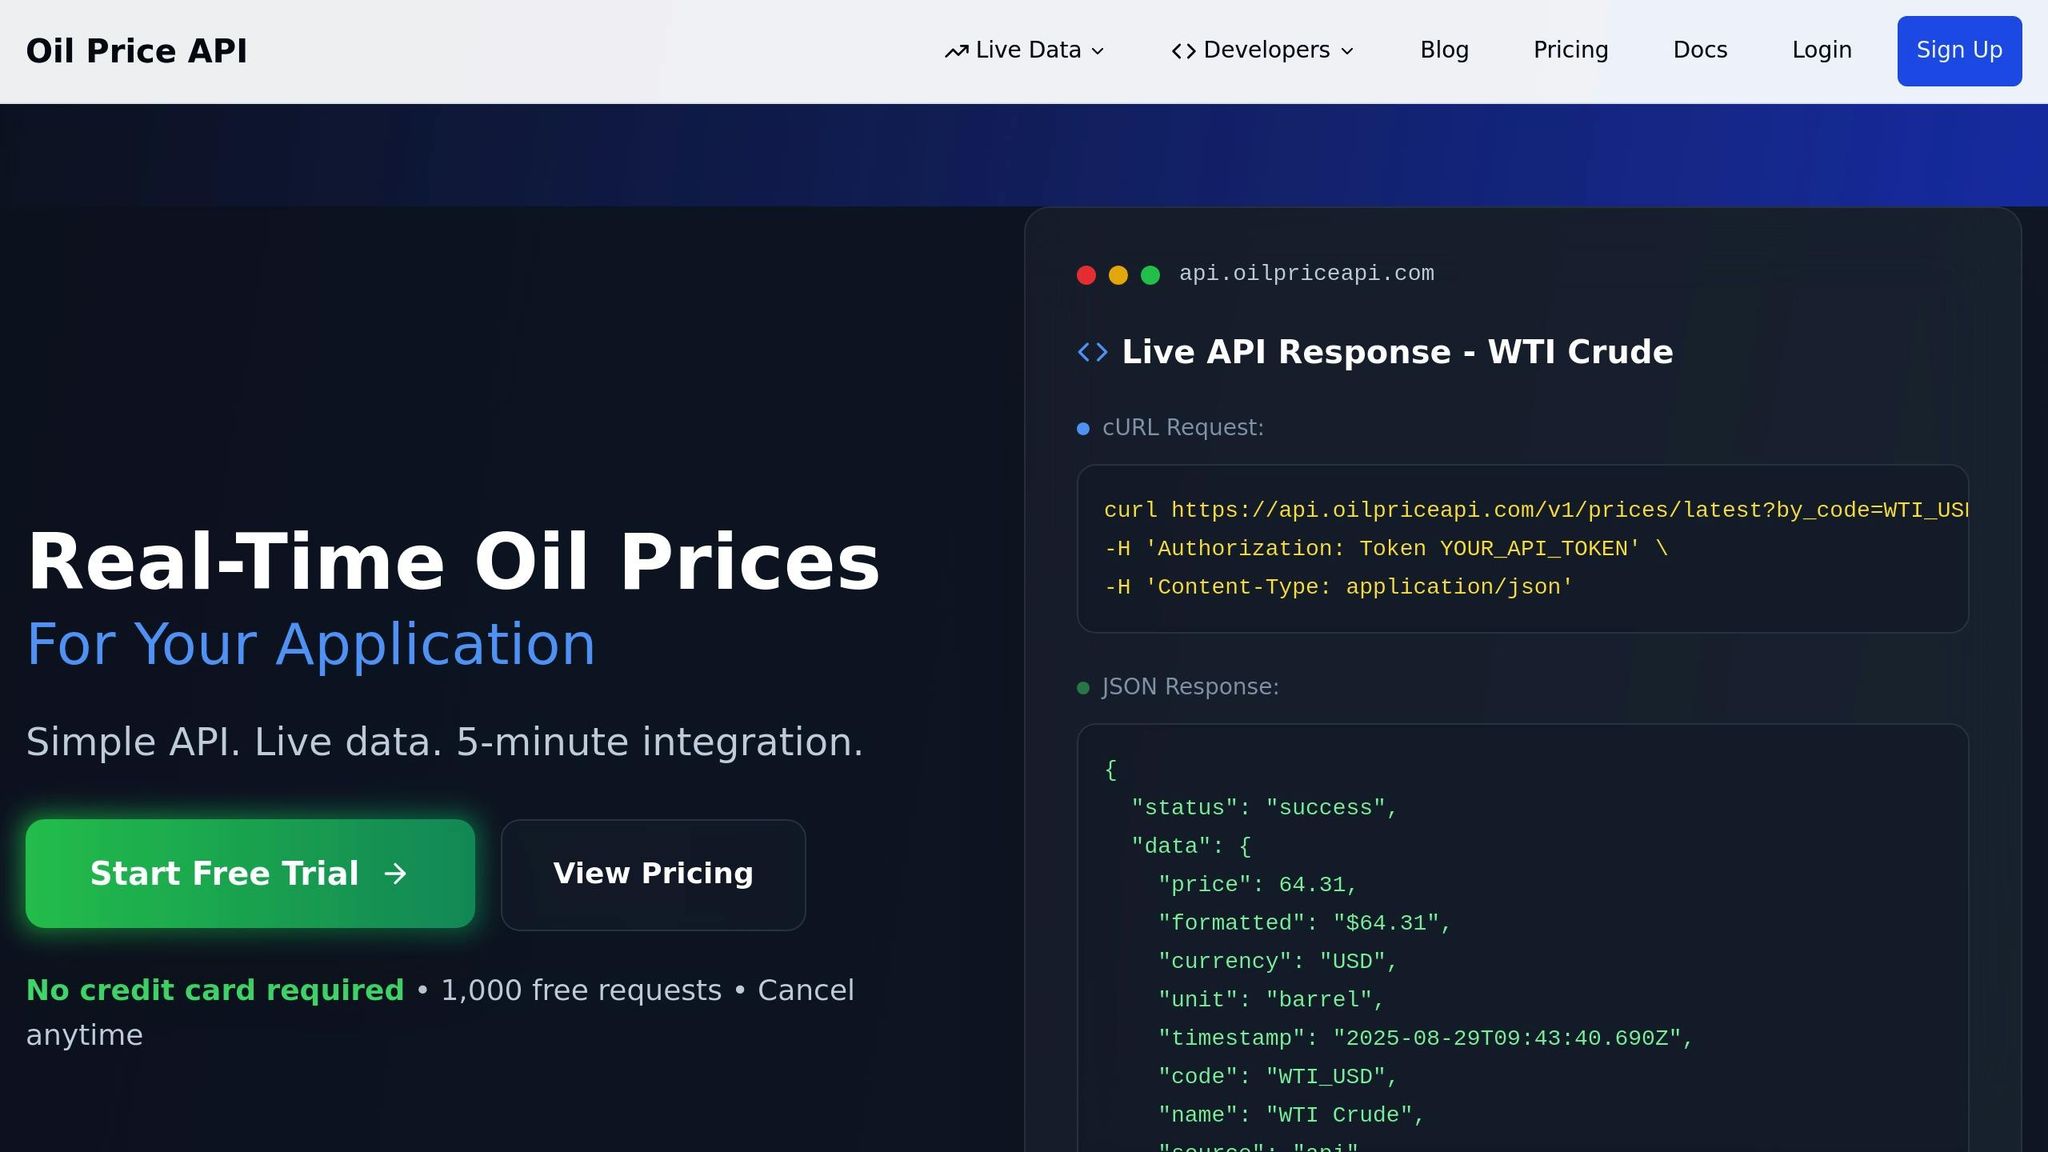
2. OilpriceAPI
Data Accessibility
OilpriceAPI simplifies access to both real-time and historical commodity data through a single JSON REST API. Instead of juggling multiple sources, traders and analysts can directly retrieve pricing details for key commodities like Brent Crude, WTI, Natural Gas, and Gold with straightforward API calls. This streamlined approach removes technical hurdles, making institutional-grade commodity data accessible to smaller firms and independent analysts.
The API is designed with developer-friendly integration in mind, allowing even those with minimal financial data expertise to incorporate commodity pricing into their tools. Whether you're working on a portfolio management system or conducting in-depth economic research, the standardized JSON format ensures smooth and consistent data delivery. This ease of integration opens the door to more robust market analysis.
Usefulness for Analysis
When shifts in economic growth impact commodity demand, having real-time and detailed metrics is crucial for tracking these changes. OilpriceAPI offers multiple endpoints tailored to different time frames, enabling analysts to dive into daily price fluctuations during major economic events or take a broader view of trends over extended periods.
The platform's historical data is particularly helpful for examining how economic indicators align with commodity price movements. This context allows analysts to uncover recurring patterns during similar economic conditions, providing a deeper understanding of market behavior.
Portfolio managers also gain an edge with the API’s consistent data formatting across various commodities. For example, during times of economic uncertainty, when investors pivot to safe-haven assets like gold while demand for industrial commodities declines, having centralized access to pricing data enables quicker portfolio adjustments and more informed risk management. The combination of real-time updates and historical metrics makes OilpriceAPI a valuable tool for analyzing commodity trends comprehensively.
Historical Relevance
OilpriceAPI bridges the gap between real-time market data and historical trends, offering insights into how economic cycles influence commodity prices. Its historical data spans significant economic events, such as the dot-com crash, the 2008 financial crisis, and other pivotal moments in modern markets. This depth allows analysts to study how commodities reacted during major transitions, providing valuable lessons for current market conditions.
Cyclical Clues to Commodity Prices
sbb-itb-a92d0a3
Pros and Cons
Analysts often weigh the merits of traditional historical records against modern tools like OilpriceAPI when analyzing how commodities influence economic cycles. This comparison sheds light on the strengths and weaknesses of each approach.
Traditional historical price records are typically sourced from various public platforms. These records offer broad coverage of past economic cycles, but accessing and organizing the data can be a labor-intensive process. Analysts might spend hours gathering information from different sources, converting file formats, and ensuring the data is consistent before they can even begin their analysis.
OilpriceAPI streamlines this process by centralizing commodity data in a standardized JSON format. This eliminates the need to juggle multiple platforms or reconcile inconsistent datasets. However, its coverage is limited to four major commodities - Brent Crude, WTI, Natural Gas, and Gold - which may not be sufficient for analysts needing a more comprehensive view of all assets tied to economic cycles.
Here’s a side-by-side comparison of the two approaches:
| Aspect | Historical Price Records | OilpriceAPI |
|---|---|---|
| Data Coverage | Wide range of commodities and markets | Focused on Brent Crude, WTI, Natural Gas, and Gold |
| Access Speed | Slow, requiring manual compilation | Fast with real-time API calls |
| Data Consistency | Varies across sources, requiring standardization | Consistent across all endpoints |
| Historical Depth | Decades of data for long-term analysis | Covers major economic events |
| Integration Complexity | Requires manual processing and format conversion | Developer-friendly and easy to integrate |
| Cost Structure | Free but labor-intensive | Subscription-based with clear pricing tiers |
| Update Frequency | Depends on source publication schedules | Real-time during market hours |
Cost and Efficiency
Cost plays a big role in deciding between these two options. While traditional records are often free, the hidden costs of manual data gathering and standardization can add up quickly. On the other hand, OilpriceAPI’s subscription model offers transparent pricing, which can save time and reduce the need for in-house data management systems. For analysts working in fast-moving markets, these efficiencies can make a significant difference.
Data Accuracy and Reliability
Accuracy is another key factor. Historical records from established institutions are usually well-verified, but inconsistencies can crop up when combining data from multiple sources. OilpriceAPI, by contrast, ensures consistent data quality across all its endpoints. That said, relying on a single provider may raise concerns for some users who prefer diversified data sources.
Historical Context
For long-term economic studies, traditional records often provide a more extensive historical backdrop. Analysts examining events like the 1970s oil crisis or the stagflation of the 1980s will find valuable insights in these older datasets. Meanwhile, OilpriceAPI offers robust historical coverage for more recent decades, which is often sufficient for analyzing contemporary trends.
Technical Simplicity
From a technical standpoint, modern API solutions like OilpriceAPI are a game-changer. Traditional methods demand custom workflows, file format conversions, and ongoing data storage maintenance. OilpriceAPI removes these obstacles, allowing analysts - especially those in smaller firms or working independently - to focus on deriving insights rather than wrangling data.
This comparison highlights the trade-offs between the two approaches, helping analysts choose the best option based on their specific needs and priorities.
Conclusion
Grasping the connection between economic growth cycles and commodity prices requires a blend of historical perspective and up-to-the-minute data. This combination forms the backbone of the analysis discussed in earlier sections.
Historical data lays the groundwork, revealing long-term trends and recurring themes in how commodities respond to different economic phases. But in today’s fast-paced markets, real-time data is indispensable. It captures immediate price shifts triggered by economic indicators, policy changes, or unforeseen global events.
The evolution from traditional data sources to modern tools like OilpriceAPI highlights a major transformation in commodity research. Platforms like OilpriceAPI offer real-time, reliable metrics for key commodities - such as Brent Crude, WTI, Natural Gas, and Gold - delivered seamlessly in a standardized JSON format. This technology simplifies the process of monitoring and analyzing market dynamics, as outlined earlier.
For analysts, the best results come from combining these two approaches. Historical data provides the necessary context to recognize patterns and long-term trends, while real-time APIs reveal immediate market reactions. Together, they enable researchers to determine whether current price movements align with historical expectations or signal new trends in economic relationships.
During periods of economic turbulence, the value of structured API data becomes even more apparent. Rapid price changes demand quick, accurate analysis, and APIs make it easier to interpret these shifts in real time. This efficiency is critical for navigating volatile markets and drawing meaningful conclusions.
FAQs
How do geopolitical events and supply chain issues affect commodity prices during economic slowdowns?
Geopolitical events and disruptions in supply chains can significantly influence commodity prices, especially during periods of economic slowdown. These factors often inject a sense of uncertainty into markets, causing noticeable shifts in the prices of essential resources like oil, natural gas, and metals.
Take oil, for instance. When geopolitical tensions or trade restrictions disrupt production, the supply shrinks. This can lead to price spikes, even if the economy is sluggish and demand is relatively low. Similarly, supply chain bottlenecks can slow down the delivery of critical commodities, adding another layer of complexity to market behavior.
To navigate these shifts, having access to real-time and historical data on key commodities like Brent Crude, WTI Crude, and Gold is essential. This data allows for better tracking of price movements and provides insights into how these factors shape market trends.
What are the benefits of using real-time data from platforms like OilpriceAPI to analyze commodity trends?
Real-time data from platforms like OilpriceAPI delivers up-to-the-minute insights into commodity markets, enabling traders and analysts to respond swiftly to price changes and market volatility. This immediacy allows for quicker, more informed decisions and helps reduce risks in rapidly shifting environments.
Instead of depending solely on historical data, real-time information captures the current market landscape, offering a sharper view of ongoing trends. This approach improves forecasting precision and provides a strategic advantage when planning investments or adapting to economic changes.
How can businesses and investors use commodity price data to navigate economic uncertainty?
During uncertain economic times, businesses and investors can make more informed decisions by leveraging real-time and historical commodity price data. Real-time data provides a snapshot of current market trends - rising prices might hint at economic growth, while falling prices could signal a slowdown. Meanwhile, historical data uncovers long-term patterns and cycles, offering valuable insights for planning and managing risks.
By blending these two perspectives, businesses can better protect against risks, fine-tune their supply chain strategies, and identify opportunities even in volatile markets. For investors, this data becomes a powerful tool for predicting market movements and making smarter portfolio adjustments. Recognizing the connection between commodity prices and economic cycles is crucial for staying ahead during uncertain times.